R-naught is just an average: the transmission rate varies widely, and outbreaks can be surprisingly large even when the epidemic is subcritical.
Read the Reflection, written 13 August 2021, below the following original Transmission.
Much of the coverage of COVID-19 talks about R0, the average number of people each sick person infects. If R0 is bigger than 1, cases grow exponentially, and an epidemic spreads across the population. But if we can keep R0 below 1, we can limit the disease to isolated outbreaks and keep it under control.
But R0 is only an average. Your ability to practice social distancing depends on whether you are a first responder or healthcare worker, whether you have to work in close quarters, or whether you can work comfortably from home. (I’m one of the lucky few getting paid to work from my garden.) It depends on how seriously you take your government’s warnings and how seriously your government takes the warnings of public health experts. And it depends on the structure of your family and your home.
As a result, R0 varies wildly, not just from region to region, but across social space, as well. In New Mexico, Santa Fe has very few new cases, but there has been an explosion of cases in rural areas due to lack of running water, multi-generational homes, and other factors. As of April 26, 47 percent of our confirmed cases are in Native American communities, even though Native Americans make up only 11 percent of New Mexico’s population. Clearly R0 is larger in some parts of the state and of society than others.
Even if R0 < 1, outbreaks can be surprisingly large. Suppose you meet 10 people while you are contagious, and you infect each one with a probability of 8 percent. The average number of people you infect is 10×0.08 = 0.8, less than 1. But those you infect may infect others in turn, and so on. If an outbreak starts with you, how many “descendants” will you have? A classic calculation shows that, if R0= 0.8, then the average number of people in this chain reaction is 1/(1 - 0.8) = 1/0.2 = 5. But, like R0 itself, this is only an average. Like earthquakes and forest fires, outbreaks have a “heavy tail” where large events are common.
Here is a visualization of 100 random outbreaks. The average size is indeed 5, and most outbreaks are small. But about 1 percent of those outbreaks have size 50 or more, ten times the average, and in this simulation the largest of these 100 outbreaks has size 82. This tail gets heavier if R0 is just below the phase transition at R0 = 1. If R0= 0.9, the average outbreak size is 10, but 1 percent have size 140 or more.

Figure 1. A hundred random outbreaks in a scenario where each sick person interacts with 10 others, and infects each one with probability 8 percent. Here R0 = 0.8 and the average outbreak size is five, but 1 percent of the outbreaks have size 50 or larger, and in this run the largest has size 82.
This tail has real effects. Imagine 100 small towns, each with a hospital that can handle 10 cases. If every town has the average number of cases, they can all ride out the storm. But there’s a good chance that one of them will have 50 or 100, creating a “hot spot” beyond their ability to respond.
The tail of large events gets even heavier if we add superspreading. We often talk of “superspreaders” as individuals with higher viral loads, or who by choice or necessity interact with many others. But it’s more accurate to talk about superspreading events and situations — like the Biogen meeting, the chorus rehearsal, or the pork processing plant, as well as prisons and nursing homes — where the virus may have infected many of those present.
Suppose that 20 percent of cases generate one new case, 10 percent generate 2, 4 percent generate 5, and 1 percent “superspread” and generate 20 (and the remaining 65 percent infect no one). The average number of new cases is again R0= 0.8. Let’s generate 100 random outbreaks with this new scenario.
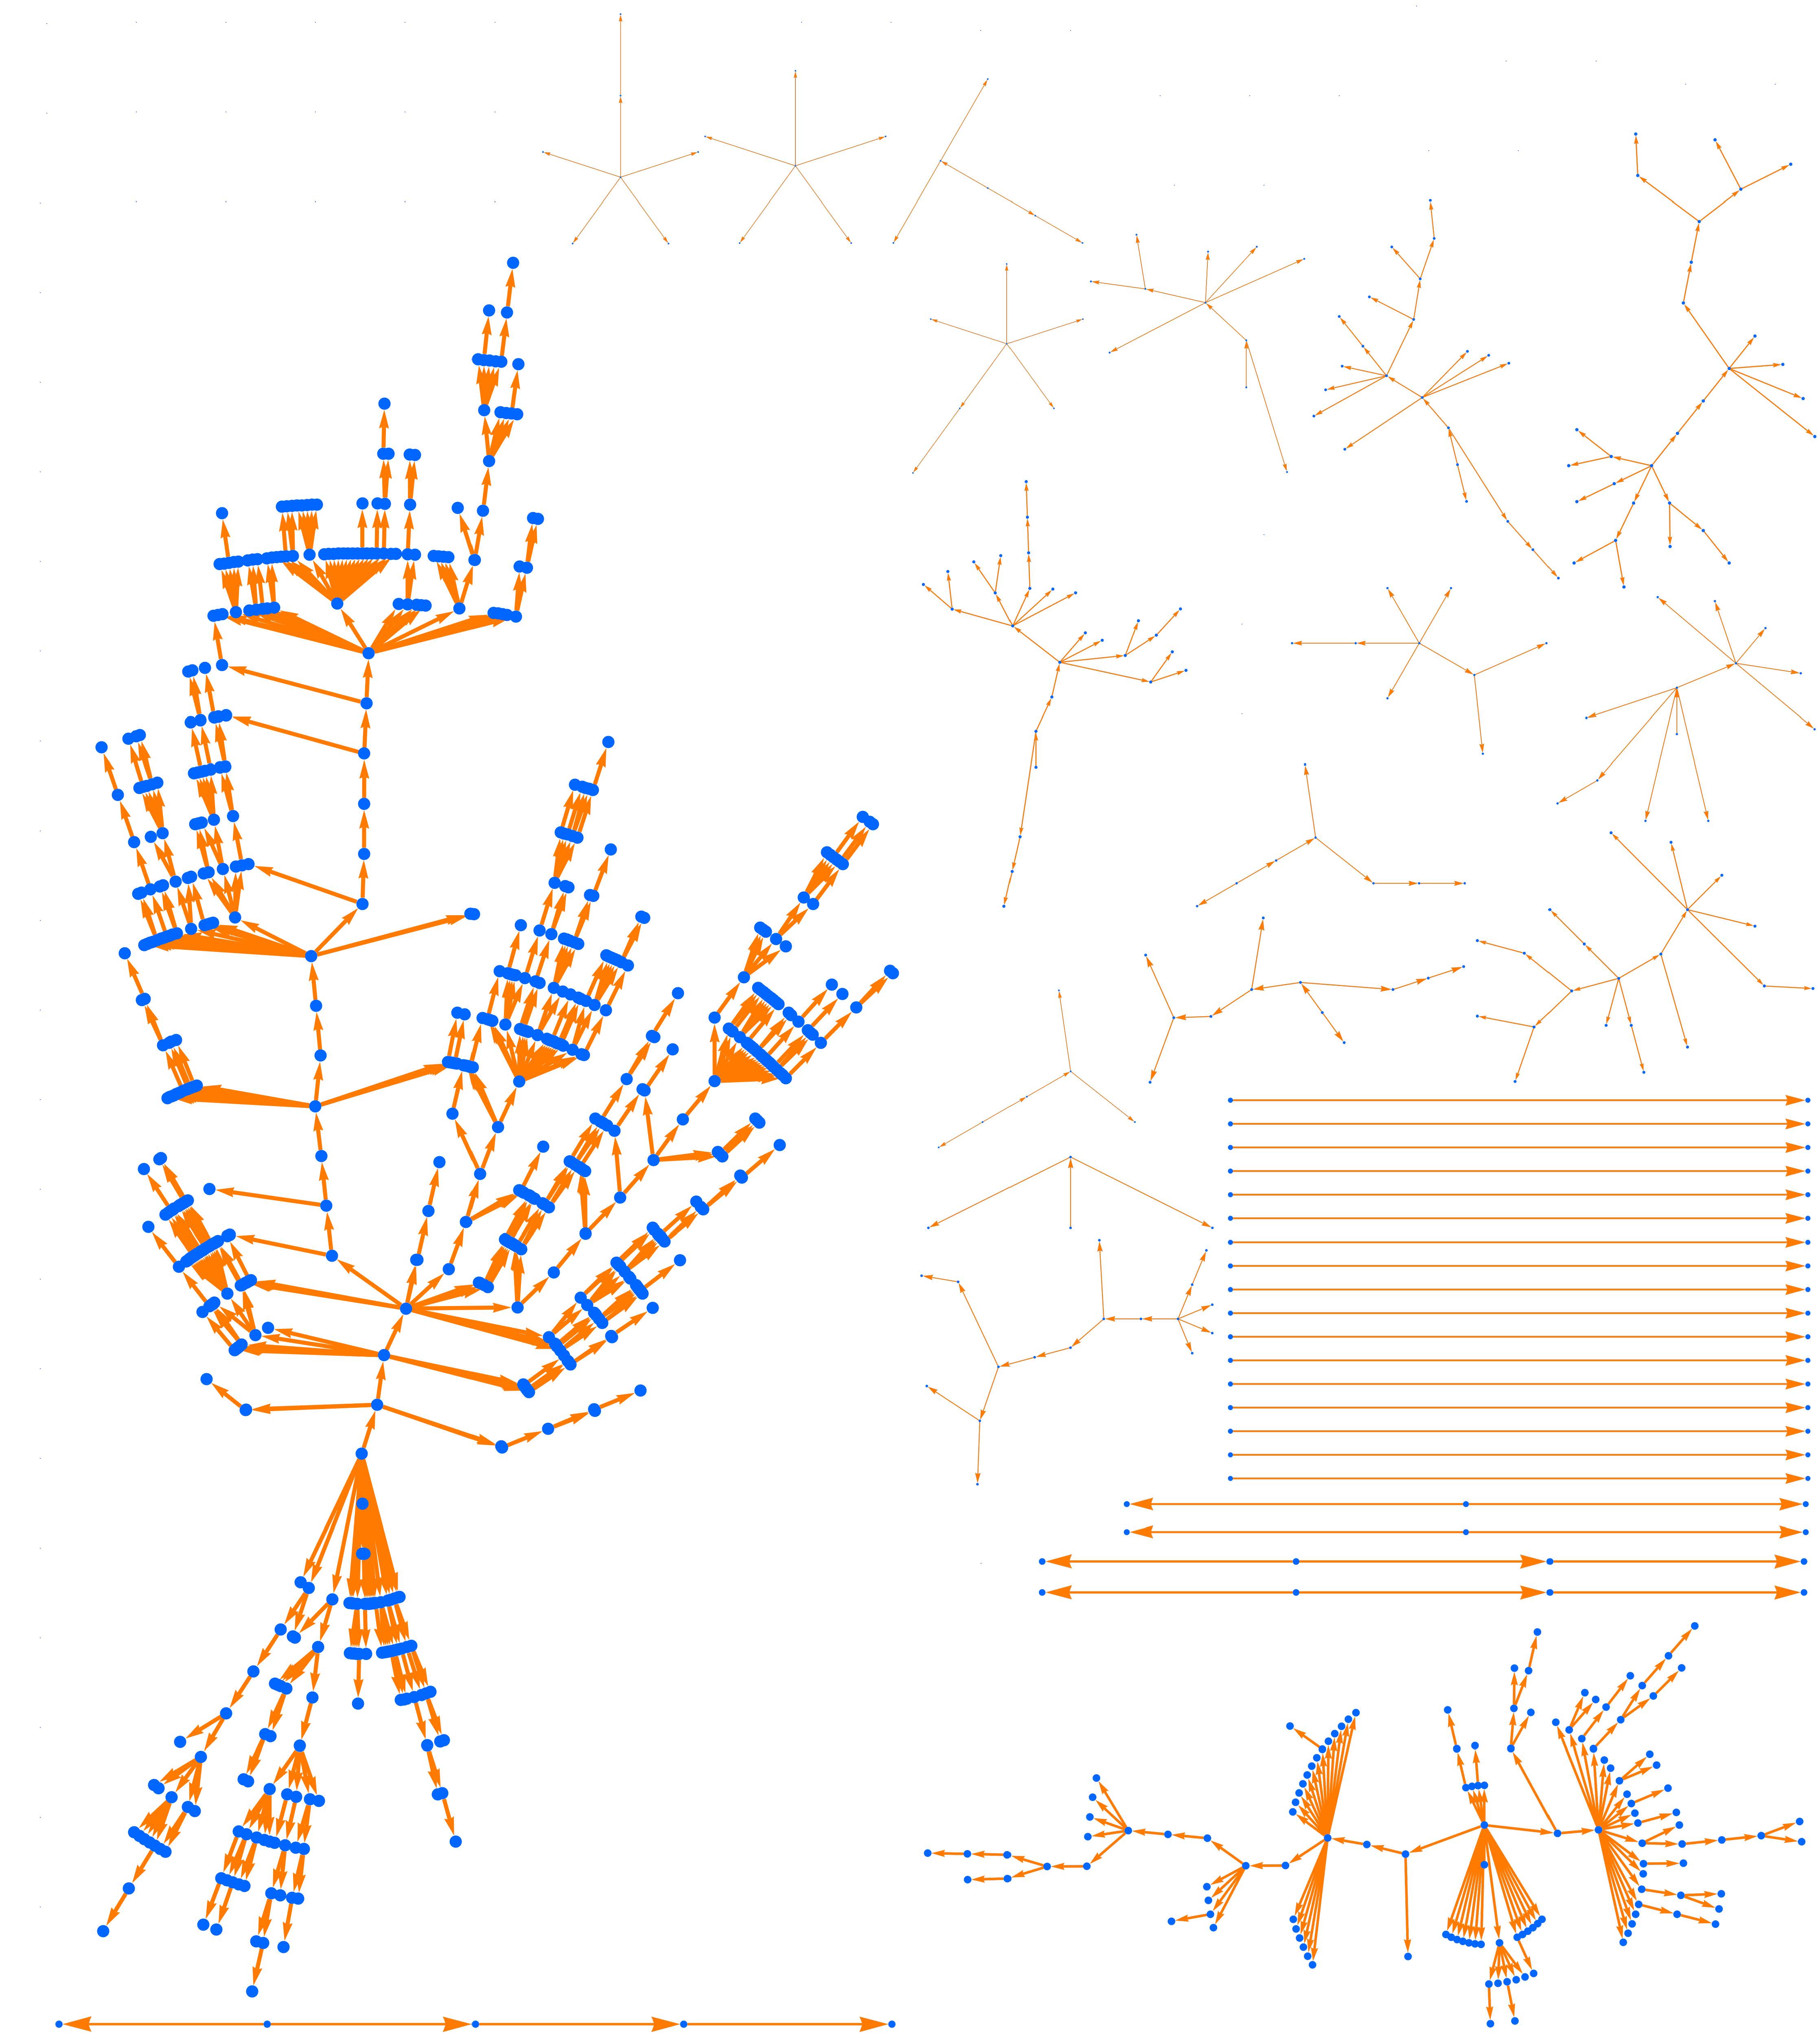
Figure 2. A hundred random outbreaks in a scenario with superspreading, where 1 percent of the cases infect 20 others. As in Figure 1, we have R0 = 0.8 and the average outbreak size is 5, but now the heavy tail of outbreaks is much heavier. In this run the largest outbreak has size 663.
The average outbreak size is still 5, but now the tail is much heavier. If just one of the 100 original cases is involved in superspreading, we get a large outbreak. If there are several generations of superspreading, the size multiplies. As a result, large outbreaks are quite common, and the largest one in this simulation has 663 people in it.
What does all this mean? First, it can be misleading to look at statewide or national averages and celebrate if R0 seems to be falling below 1. The epidemic could still be raging in particular places or among particular groups.
Second, even if R0 is below 1, we need to prepare for hot spots. Even if the average outbreak is small, large outbreaks will occur due to superspreading or simply by chance. If we do a fantastic job at testing and contact tracing — using both technology and human effort — we will get this pandemic under control, but for the foreseeable future there will be times and places where it flares up and strains local resources. And through those flare-ups, we have to do our best to help each other, and hope that intelligent, generous voices prevail.
Cristopher Moore
Santa Fe Institute
REFERENCES
- Laurent Hébert-Dufresne, Benjamin M. Althouse, Samuel V. Scarpino, and Antoine Allard, “Beyond R0: Heterogeneity in secondary infections and probabilistic epidemic forecasting.” https://arxiv.org/abs/2002.04004
- J. O. Lloyd-Smith, S. J. Schreiber, P. E. Kopp, and W. M. Getz, “Superspreading and the effect of individual variation on disease emergence.” Nature 438 (2005) 355–359.
Read “Coronavirus Doesn’t Care About Your Data Points” in Bloomberg (May 11, 2020).
Read more posts in the Transmission series, dedicated to sharing SFI insights on the coronavirus pandemic.
Listen to SFI President David Krakauer discuss this Transmission in episode 31 of our Complexity Podcast.
Reflection
August 13, 2021
Complexity Doesn’t Always Require Complex Models
A raging virus is devastating society, amplifying every form of inequality, and revealing the utter cravenness of our political leaders. What’s a theorist to do?
I experienced most of the pandemic from the safety and peace of my garden. I myself have the freedom to radically reduce my human contact while continuing to feed my family. Transit workers, meatpackers, guards and inmates, single mothers, and people living in three-generation homes do not.1 And, in addition to these heartbreaking inequities in employment and health, we have the infuriating fact that many others have the option to be safe but choose not to—and that this behavior is aided and abetted by some of the most powerful in our society.
Last year, despite being anguished over these inequities and idiocies, I was hesitant to say anything as a scientist about COVID-19. There was already so much noise, much of it coming from dilettantes who wanted to help but who didn’t have the domain knowledge to really do so. We didn’t need another theorist claiming to predict where and when the disease would peak. But then I was struck by a basic qualitative, pedagogical point that was worth making.
In the spring of 2020, the media seized on R0—the average number of new cases generated by each case—as a measure of the spread of the virus. In the simplest models, if R0 is bigger than 1, the disease grows exponentially; if R0 is less than 1, it disappears. Websites popped up estimating R0 in various states and countries. If we can push R0 below 1, they said, everything will be okay!
But this is far from the truth. Like in so many complex systems, what matters are rare, large events, which were sadly not so rare: superspreading in churches, workplaces, and jails. And there is no single value of R0: it varies radically by location, employment, beliefs, race, and class.
The Transmission series gave me a perfect opportunity to point this out. Using some basic math and simple simulations, I pointed out that large outbreaks can occur even if R0 is less than 1. This happens by chance even without superspreading events, due to the multiplicative nature of epidemics, but it happens even more with them. It led to some media, peaking with a quote in The Wall Street Journal and a very brief appearance on Don Lemon’s show on CNN. Although the same basic point appeared later in a number of venues, I felt I had done some good.
Looking back over the past year, it’s clear that the right response to complexity is not always building a more complex model. Many attempts to build more realistic models for COVID-19 foundered on fundamental uncertainties about the disease and about society. The lack of effective testing and contact tracing meant that we were flying almost blind, making even simple models hard to validate. Friends of mine struggled to fit their model parameters to flawed and ever-changing data, and the effect of every intervention or re-opening was delayed by two to six weeks. It took months to understand that surfaces don’t play much of a role in transmission, that aerosols do, and to finally learn that, yes, children can spread the disease.
While dire predictions can help spur action, demanding that predictions be precise and specific is a fool’s errand. We don’t, and can’t, know precisely where a disease will spread, or how a hotter planet will change. But this is no excuse for inaction.
Unfortunately, intellectual humility and embracing uncertainty—the key values of science—do not play well with policy. Politicians complained that scientists’ changing recommendations were contradictory. They embraced models they liked, including amateurish data-fitting embarrassments like Kevin Hassett’s “cubic model,” and ignored the ones they didn’t. Early entrants like the Institute for Health Metrics and Evaluations’ (IHME) model were media successes but not scientific ones, and in reality provided little more than a cartoon. Someone should write a post pestis of the roles, both good and bad, that modeling played in the policy debate.
In the absence of crystal balls, the basic message about COVID-19 remains the same: this thing is real, be kind to each other, be patient. Avoid leaders who whip up a mood of willful ignorance. Break the human habit of using every frustration and hardship as a chance to divide “us” and “them.” Mobilize society’s resources at every level to solve the problem, and support those for whom the intervening time is the most difficult.
Just like we need to do to address climate change.
Read more thoughts on the COVID-19 pandemic from complex-systems researchers in The Complex Alternative, published by SFI Press.
Reflection Footnotes
1 See T-031, “Melanie Moses and Kathy Powers on models that protect the vulnerable”